Strava ride data with Python & Pandas
After spending the past 2.5 months madly finishing up projects, cycling took a serious back seat. Which is OK, because as you will see, cycling took the driver’s seat for much of 2018.
Now that the projects are done (or at least at v1), I’ve been itching to look at my Strava data again, this time with Python. In fact, I’ve been itching to look at my ride data a helluva lot more than to go riding.
That’s a bit of a problem, fitness-wise, although it gave me even more incentive to connect to the Strava API.
Here are some simple overview plots using variations on Pandas’ df.plot(kind = 'barh') that show my annual progressions for some ride stats.
For the sake of clarity, you’ll find all the code to get, clean & plot Strava data after the plots.
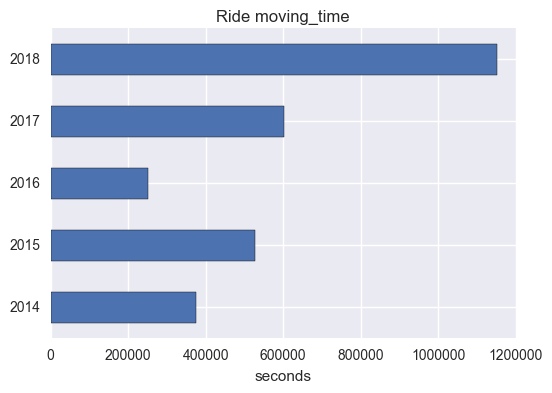
How much time did I spend on the bike?
How many rides were done on the trainer?
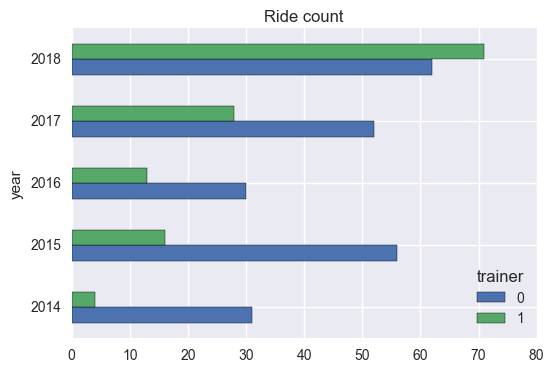
This could explain why I found myself dreading the trainer by the end of the year.
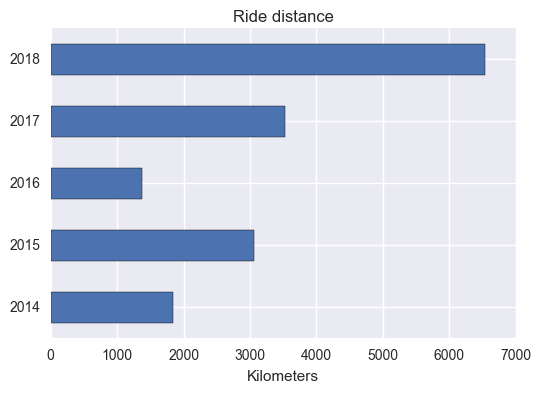
How far did I go?
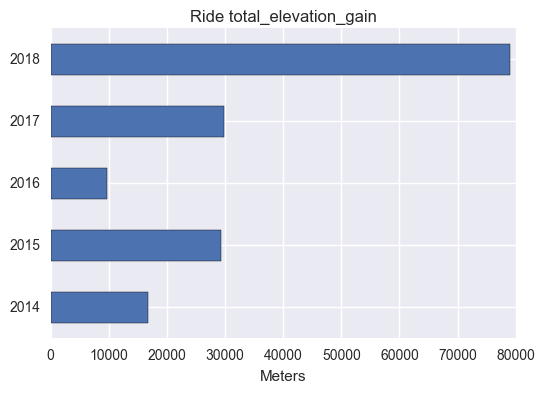
And how much climbing was involved?
Admittedly, these can hardly compete with the slick video Strava sends you at the end of the year. However, it has been satisfying being able to look at stats that Strava doesn’t talk about much, if at all, like rides done on the trainer, as well as being able to see my annual progression.
Code
Get the data
# import librairies

import urllib2
import json
import pandas as pd

import matplotlib as plt
%matplotlib inline

import seaborn as sns
sns.set()

# For the base URL we use for activities
token = 'c3f*********' # replace with your token
base_url = "https://www.strava.com/api/v3/activities?access_token=%s&per_page=200&page=" % token
page_num = 1

# To store the json response
my_acts = "my_activities.txt"
cols = ["start_date","type","name","id","average_cadence",
        "average_heartrate","average_speed", "distance",
          "moving_time", "location_city", "pr_count","suffer_score",
          "trainer", "total_elevation_gain", "workout_type","map"]
### Starter code adapted from http://pdwhomeautomation.blogspot.fr/2014/11/raspberry-pi-and-strava-api-1.html

def get_strava_data(token = token, filename = my_acts):
    #Open the my_file to use
    my_file = open(filename,'w')

    #Loop extracting data.  Remember it comes in pages
    end_found = False
    page_num = 1

    strava_df = pd.DataFrame(columns = cols)


    #Main loop - Getting all activities
    while (end_found == False):
        #Do a HTTP Get - First form the full URL
        act_url = base_url + str(page_num)
        strava_json = urllib2.urlopen(act_url).read()

        if strava_json != "[]":   # Checks for empty JSON response, i.e. end of activities
            #Now we process the JSON
            act_json = json.loads(strava_json)
            page_df = pd.DataFrame(act_json)

            # reduce number of fields in df
            # page_df = page_df[cols] TO FIX: key error with avg HR
            strava_df = strava_df.append(page_df)

            #Set up for next loop
            cum_sum = page_num * 200
            print("{} activities printed...".format(cum_sum))
            page_num += 1
            strava_json = []

        else:
            end_found = True
            print("*** No more activities. ***")

    return strava_df
# create data frame

strava_df = get_strava_data()
200 activities printed...
400 activities printed...
600 activities printed...
800 activities printed...
1000 activities printed...
1200 activities printed...
*** No more activities. ***
Data wrangling
## Helper functions

def s_to_hrs(secs):
    m, s = divmod(secs, 60)
    h, m = divmod(m, 60)
    #d, h = divmod(h, 24)
    return("{} hrs, {} m".format(h,m))

def clean_strava(df = strava_df, cols = cols):

    # limit columns
    mystrava = df.copy()[cols]
    mystrava['start_date'] = pd.to_datetime(mystrava['start_date'], yearfirst = True, infer_datetime_format = True)

    # extract month & year
    mystrava['year'] = pd.DatetimeIndex(mystrava['start_date']).year
    mystrava['month'] = pd.DatetimeIndex(mystrava['start_date']).month

    # convert moving time to integer
    convert_cols = ['moving_time', 'pr_count', 'suffer_score', 'trainer']
    mystrava[convert_cols] = mystrava[convert_cols].fillna(0).astype(int)

    # convert distance to KMs
    mystrava['distance'] = mystrava['distance'].divide(1000)

    return mystrava
# clean up & filter data
types = ['Ride']
q = "type in @types & year < 2019 & year > 2009"

mystrava = clean_strava().query(q)
# sum activities by year
mystrava_by_yr = mystrava.set_index(['id']).groupby(['year','type']).sum()
# create moving_hrs
mystrava_by_yr['moving_hrs'] = mystrava_by_yr['moving_time'].apply(lambda x: s_to_hrs(x))
## plot function
types_str = ", ".join(types)

def act_bar(df = mystrava_by_yr, metric = 'moving_time', unit = 'seconds', legend = False):
    ax = df.reset_index().query(q).set_index('year')[['type', metric]]\
    .pivot(columns = 'type', values = metric)\
    .plot(kind='barh', legend = legend,
          title = "{} {}".format(str.title(types_str), metric))
    ax.set_ylabel("")
    ax.set_xlabel(unit);
plots
Summary plots
# how much time did I spend on the bike?
act_bar()
# how much is that in hours & minutes?
mystrava_by_yr.query(q)['moving_hrs']
year  type
2014  Ride    103 hrs, 50 m
2015  Ride    146 hrs, 29 m
2016  Ride     69 hrs, 55 m
2017  Ride    167 hrs, 32 m
2018  Ride    319 hrs, 35 m
Name: moving_hrs, dtype: object
# how many rides?
mystrava.query(q).groupby(['year']).count()['id'].sort_index(ascending = False)
year
2018    133
2017     80
2016     43
2015     72
2014     35
Name: id, dtype: int64
# how many of those were on the trainer?
mystrava.query(q).groupby(['year', 'trainer']).count()['id'].unstack()\
    .plot(kind = 'barh',
          title = "{} count".format(types_str));
# how far did I go?
act_bar(metric = "distance", unit = 'Kilometers')
# how high did I climb?
act_bar(metric = 'total_elevation_gain', unit = "Meters")